
In recent trading sessions, the price of Dogecoin has experienced an upward trend, surpassing a significant resistance level. Over the past 24 hours, DOGE recorded a 1.2% increase, and within the last week, the coin appreciated by 2%.
The technical analysis suggests the possibility of upcoming bullish momentum as buying strength attempts to recover. However, demand and accumulation indicators have not yet entered the positive zone.
To establish bullish control in subsequent sessions, DOGE must surpass a crucial resistance level. The broader market’s recovery, including Bitcoin’s rise above $27,500, may also contribute to the DOGE upward price movement.
The upcoming trading sessions will be crucial in determining whether bulls or bears will dictate the price action. However, the decline in the Dogecoin market capitalization indicates current seller dominance over the asset.
Dogecoin Price Analysis: One-Day Chart
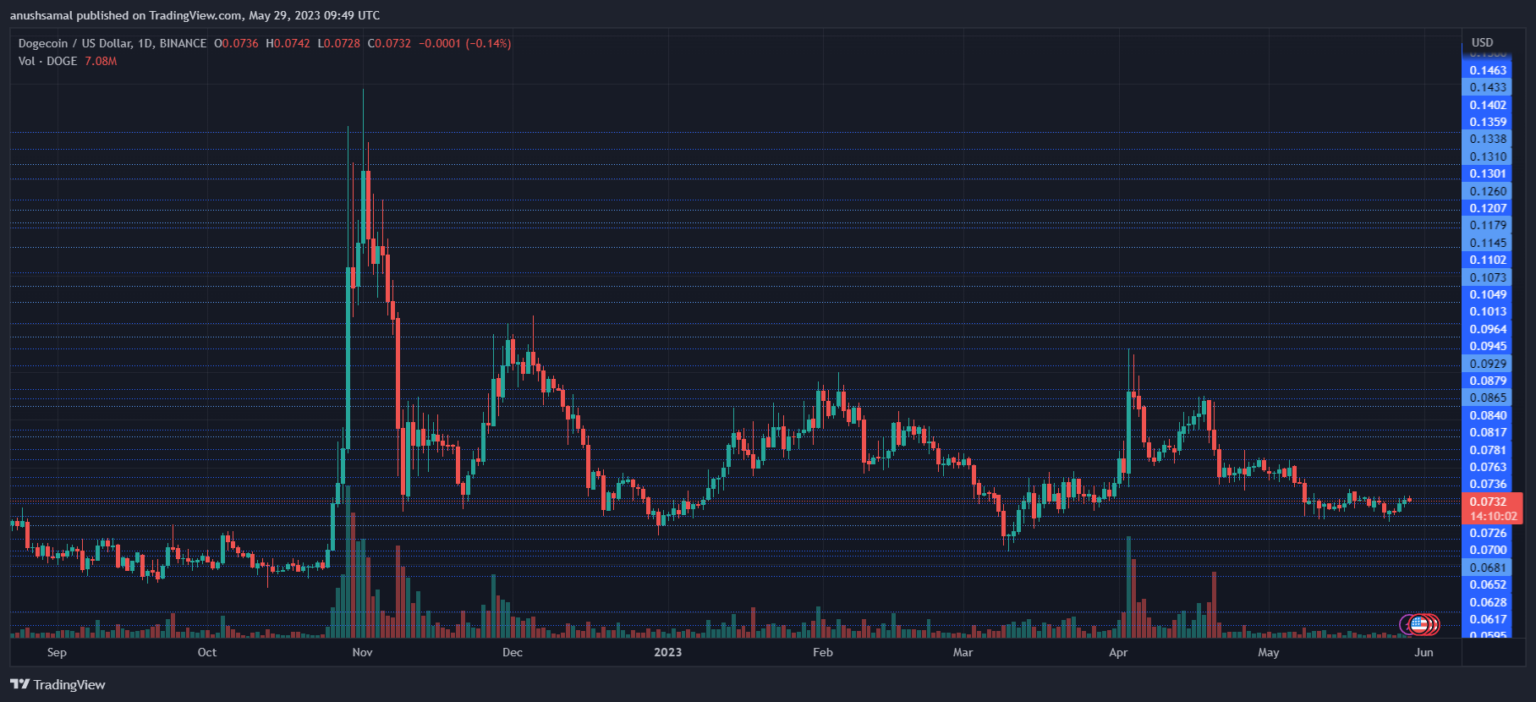
At the time of writing, DOGE was trading at $0.073 and has shown gradual gains since surpassing the $0.070 resistance line. However, a potential price correction could occur if it fails to breach its overhead resistance.
The immediate resistance level for DOGE is set at $0.075. Surpassing this level would likely trigger a rally toward the $0.078 mark, strengthening the position of the bulls.
Conversely, if DOGE fails to hold its current price level, it may decline to $0.071 and potentially drop below $0.070. The recent trading session indicated weak buying strength, as the amount of Dogecoin traded was in the red.
Technical Analysis
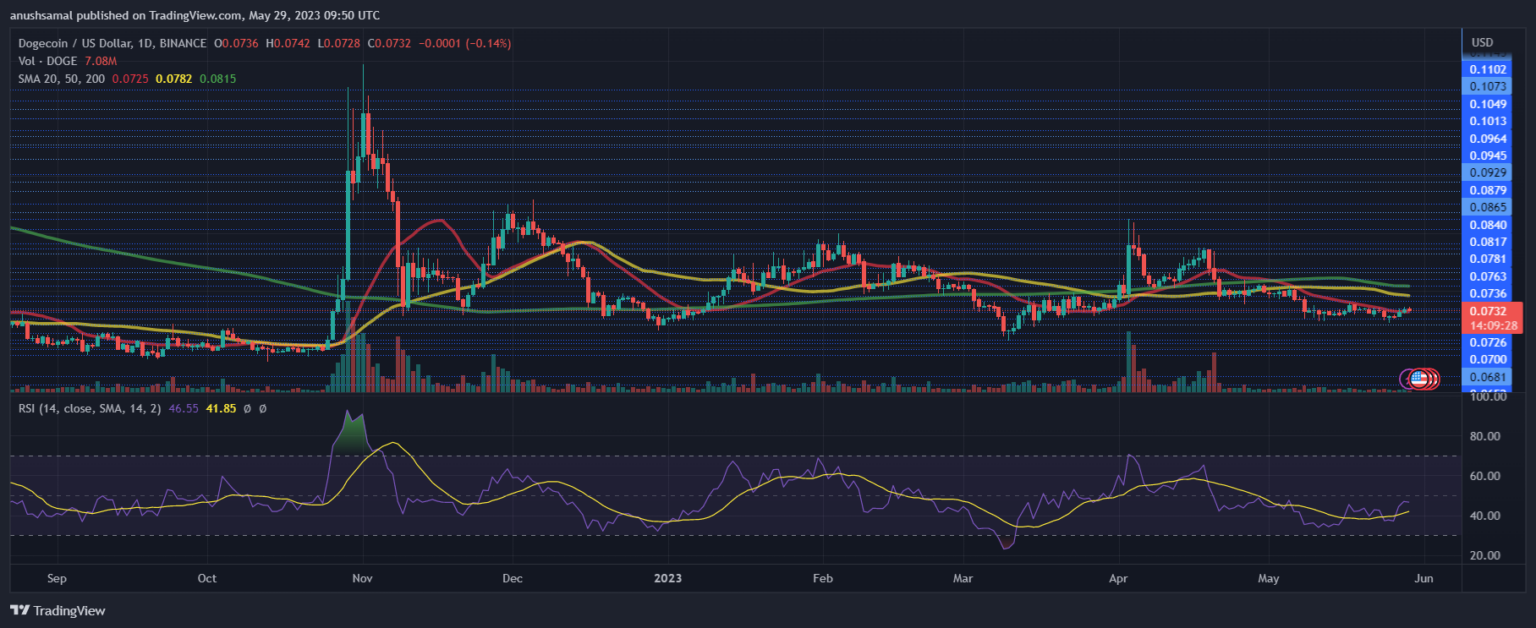
Throughout May and even April, Dogecoin faced challenges in attracting positive demand. At the current moment, buying strength remains low despite the ongoing recovery.
The Relative Strength Index (RSI) indicates that buyers still lack confidence in the asset, as it is below the half-line. Furthermore, the DOGE price has fallen below the 20-Simple Moving Average (SMA) line, indicating that sellers are driving the price momentum in the market.
However, if Dogecoin manages to surpass the $0.070 price level, it will move above the 20-SMA line, indicating increased demand and potentially reversing the current trend.
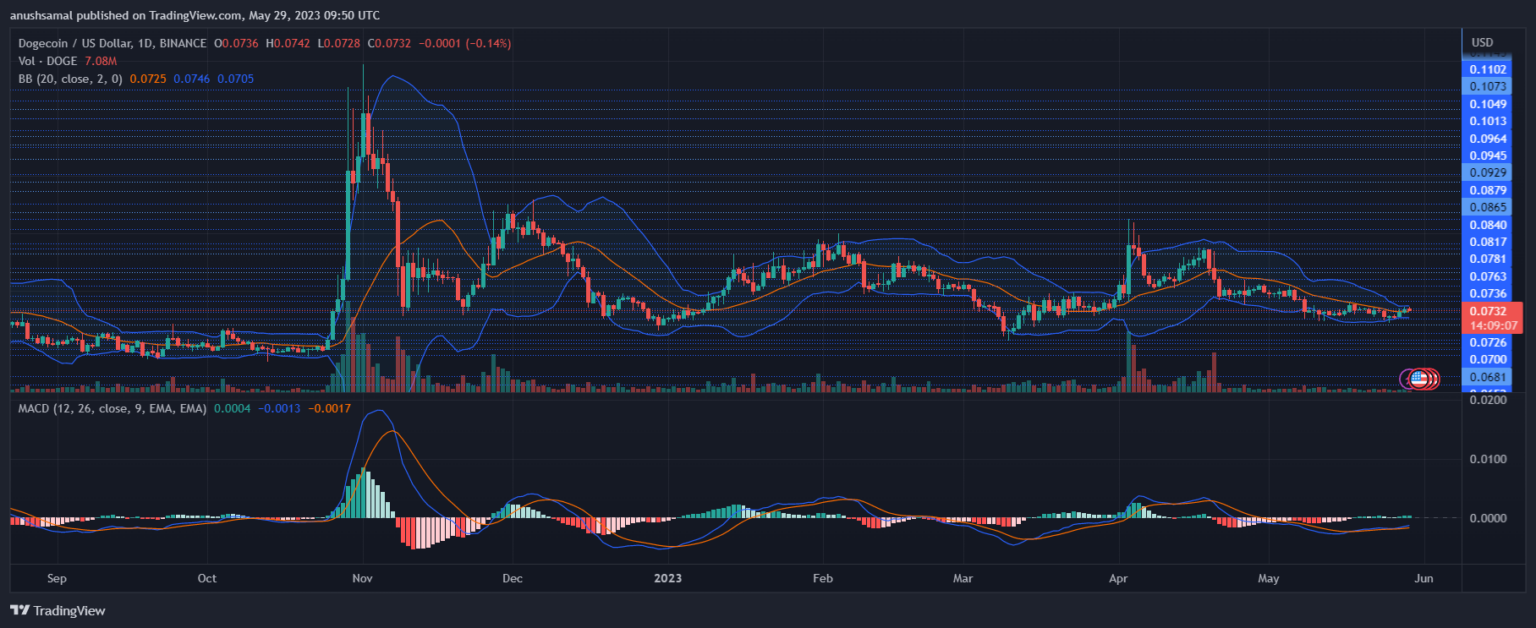
On the one-day chart, DOGE exhibited diminishing buy signals in line with other technical indicators. The Moving Average Convergence Divergence (MACD), which indicates price momentum and trend reversal, showed declining green histograms associated with buy signals.
Additionally, the Bollinger Bands, which reflect price volatility and fluctuation, displayed significant narrowing. This suggests that DOGE may experience heightened price volatility and fluctuations in the upcoming trading sessions.
Currently, DOGE is positioned at a critical price level, and the next trading sessions will determine whether the price will break out to the upside or downside.